Building Bridges

Bridges and Departure Points
Building Bridges…. Seemed like an apt beginning to the Blog and Tradewinds AI in general. With any bridge there is a departure point and a destination and it’s a great metaphor for my last 3 months professionally. Early in December my company (startup in the gaming sector) finally shuttered their doors and sent me packing. After the initial shock and a couple weeks of reflection it was probably the best thing that could have happened in my life. I lived an entirely unhealthy one, completely dominated by work (literally on-call 24x7x365) and one in which I unknowingly alienated a good number of folks in my life.
That aside for now, I was presented in a blindingly abrupt fashion a “Departure Point”, one that required a destination, but where to go, what is that exact destination? Over the last several years I had dabbled a little bit with machine learning and was intrigued by the capability and the science and engineering behind it. With that in mind I started settling on a general direction…
Finding the Destination
One of the beautiful things about my last 3 years at SuperDraft was the melding of sports and software engineering. A bit of a sports fanatic (soccer specifically) I set about understanding the process of creating machine learning models to predict the outcome of soccer matches. Funny how one sentence can encapsulate so much as I was soon to find out. It included an entirely new technical stack (Python/scikit) and a good bit of mathematical re-education to better understand what was actually going on under the covers for each model type. Making this long part of the story short, it became apparent that in order to really do this the right way, and take into account the resource and time that the models need, a pipeline of sorts would be required. Given this I settled upon the following flow with some high-level design goals:

So before jumping in and discussing each of these in a little detail, one of the big takeaways I had is just how vital the feature engineering aspect is and that the success of the model is directly related to the quality of the data it is being fed. It’s not about feeding it a ton of data, the models really need data that provide some way to attach and differentiate a stat (feature) with another stat or the actual outcome itself.
Stat Synchronization
Models need data, so given past experience with some of the providers I settled upon SportsMonk’s Soccer API as it seemed to have the richest set of stats including historical odds for a multitude of markets and a wide breadth of leagues to chose from. To properly synchronize the historical stats with the Tradewinds data store I setup a set of node processes that would mine the last 5 years of match information across 15 of the top European leagues as well as MLS. This process not only seeded the first 5 years but runs periodically to pull in new scores and updates for completed matches. At the end it turned into a mapping exercise between the highly normalized data provided by the SM API into one that was much easier to consume and process by the various services that are part of the platform. The final output is an entry/document in the “Fixtures” collection in the Tradewinds MongoDB cluster.
Feature Engineering
Simple stats are not enough for a model to really be accurate. The underlying raw stats require kneading and prodding to give the model the different perspectives it must have to properly identify one outcome from another. For the Tradewinds platform this turned into:
FeatureDomain: (Home, Away, Combined). Is the underlying stat for the home team, away team or is it a combined stat comparing home and away values)
FeatureWindow: (Micro, Small, Large). How many games historically is the stat covering. As of now, the values settled upon are 5 matches for Micro, 15 for Small and 30 for Large.
FeatureScope: (All, Closest, HomeOnly, AwayOnly). What is the scope of the stat covering? Is it for all the games for a given team or only the ones they have played at home or away? Also, the ‘Closest’ scope will take the 4 closest historical matches that have the smallest delta in match winning odds and based on the associated FeatureWindow. As an example, say Brighton is the favorite in their next game and have American Odds set at -110. What the closest scope will do is find the 4 closest matches for Brighton based on the smallest delta to that -110 odd value.
FeatureOperation: (Mean, Variance, Trend, Ratio). What operation are we doing to the stat over the FeatureWindow and taking into account the Domain and Scope? These operations include a simple mean / average, variance and slope/ratio for the raw stats being summarized.
Finally, a set of comparative stats are created providing a view into performance across alike or competing aspects of the game. This includes possession difference, shot ratios (Shot On / Shots total), defense pressure gap (merging of tackles, interceptions and duels won), attacking efficiency and crossing-parity. All told, with the combinatorial aspect of the various types of stats and how they are presented some 400+ are available to be used by the model. But which ones are most impactful? That’s what the next several steps go about determining…
Initial Model Training
After some trial and error I settled upon using the lightGBM model for use. Given the number of features available, the first pass of training (“Simulation” in Tradewinds parlance), includes 2000 model executions, each using a random set of 35 features selected from the larger set of 400+. Each model execution feature set is unique and once the 2000 separate runs are complete an assessment is made and the 125 most impactful / important ones are selected. It is vital to point out that the training that occurs does not include and should never include any of the data that it is to be tested on. In our case, we are taking the first 90% of the matches and using them as the training set. The last 10% temporally are then used to test the model’s training. Absolutely no leakage of the testing data can occur into the training set or it invalidates the process.
I won’t get into great detail here about the selection process (it will be a blog post in and of itself) but suffice it to say it is a ranking across 3 values.
Overall Value. Total profit made by the model over the test set. Each match has an odds associated with it and using a baseline wager of $100 a total profit is calculated for each run and then applied to that feature.
Importance. The scikit-learn importance metric for each feature after a simulation run
Shap value: The SHAP value for each feature after a simulation run
Feature Assessment and Refinement
After the initial run, and the top 125 features are selected, a second “training” pass occurs of 1000 simulations using a random set of 25 features selected from the initial results. Subsequently, a second selection process occurs carving the list down to the top 50 features based on the second run of simulations. These top 50 are then assessed on their value and put through a final selection run of 500 model executions with each run having a random sampling of 25 of those features.
Model Selection and Predictions
Eventually, once all the model processing is complete, the top performing model is selected and those associated features are used to predict on the upcoming set of matches. These predictions are then stored in the MongoDB cluster to be reported on in the future.
Record Results
Finally, once the matches are complete the results are stored and balances updated within the platform.
The Tradewinds Platform
So with all that being said, and getting tired of typing I present the platform as it stands now:
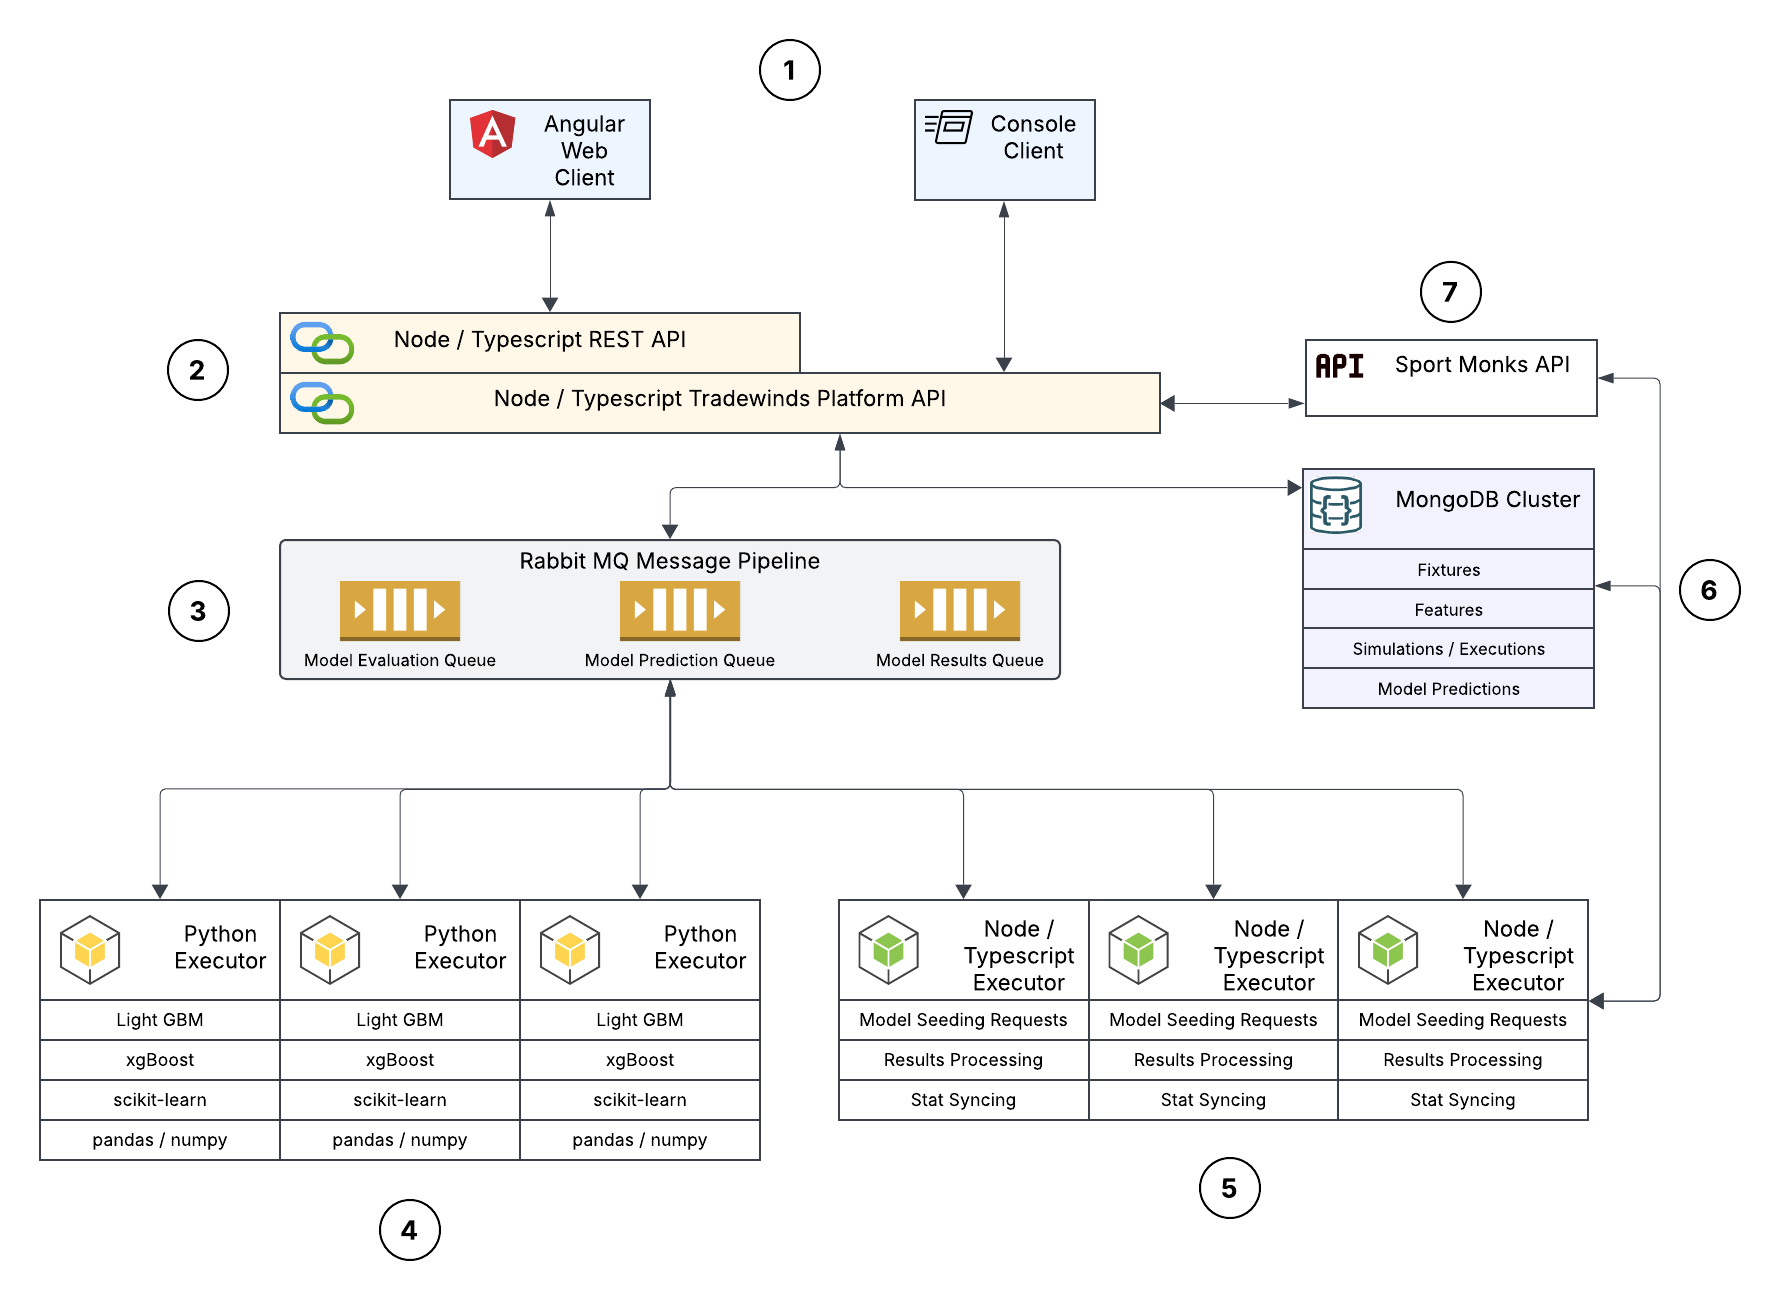
The platform itself is comprised of 6 separately deployable components and one externally consumed API. Each area is described below:
Platform Clients
Console-based client used to quickly perform a number of actions including loading data, running models, etc…. It is the main test-harness I use while developing and testing back-end operations.
Angular web-client providing views on model performance including visualization of results and feature importance, wager history / performance and dashboard controls for running the platform itself and kicking-off specific operations.
Public API
Rest-based public API for platform access. Node/Typescript project easily deployable to the cloud including all the interfaces required for proper data handoff between clients and their requested services. Includes a RabbitMQ client for sending and processing of events across the various platform services and clients.
Rabbit MQ Pipeline
Don’t really need to say much more than that. 3 queues are currently in play:
Model Seeding: A seeding request is simply the initiation of a simulation run for a given league. It is consumed by one of the Node/Typescript executors which in turn will generate a set (either 2000, 1000 or 500) of model execution requests including the specific historical stat data mapped in CSV format for consumption.
Model Execution: A request consumed by one of the Python Executors that represents a single run through the model for that feature and dataset. Once complete the results including all feature importance values are packaged up and sent to the Results queue.
Results Processing: The final message in this process is the unpacking and summarization of the results, performed by one of the Node/Typescript executors, eventually ending up in a MongoDB collection for later consumption
Python Executor
Fully deployable Python project consisting of a Rabbit MQ event consumer leading to model training and testing ending with results being summarized and surfaced for further processing. Includes all the known actors like numpy, scikit-learn and pandas. The model training includes a stratified folding process that splits the training set into 10 separate folds, each assessed separately before collating and final training / testing.
Node / Typescript Executor
Part of the Platform API project but easily deployable as a separate entity to cloud platforms. These executors are primarily responsible for seeding the model executions with the appropriate data and features as well as processing the subsequent results and storing in Mongo.
MongoDB Cluster
MongoDB database used to store all of the data required by the platform including:
Fixtures: These are the historical matches that all of the feature engineering is based upon. Goes back 5 years across 15 leagues.
Features: These are the features that are being made available to the model and described in detail above.
Simulations: These are the various simulations (initial or refinements) that are specific to a single league. Used more as a collector and associative entity for a set of Model Executions.
Model Executions: A specific model execution on a set of features and given dataset. Contains summarization of value, importance and shap values for each contained feature as well as an overall summary of profit value used for comparative purposes.
Model Predictions / Wagers: The actual prediction / wagers made by the model on future matches. Used to grade overall performance and profitability of the platform.
Well that’s about it for this post, fingers are cramping a bit but I do plan on following along pretty quickly with a post on the client itself and a discussion of model performance, testing, profitability and current results. Would love to hear any feedback, please keep in mind the website is really in a beginning stage and was generated using an overly aggressive, marketing based AI, lol. I do plan on trying to grow a community of like-minded folks to mainly start capturing the power of AI and ML and continuing to grow and learn in that sector. Who knows, we may make a little money on the way. If you made it this far, thank you!